Water Conservation + Leak Detection Monitoring Project
Project Summary October, 2020
Executive Summary
|
Before |
After |
Change |
|
|
Water / Unit / Day |
1.07 m3 |
0.79 m3 |
- 26% |
|
$ / unit / Annum |
$1675 |
$1237 |
-$228 |
|
Shower GPM |
1.6 |
1.25 |
-21% |
|
Bath Faucet GPM |
1.95 |
.75 |
-61% |
|
Kitchen Faucet GPM |
2.1 |
.95 |
-54% |
|
Annual Water Costs (2019) |
446K |
330K |
- 26% |
|
Monthly Volume (m3) |
10,166 |
8,059 |
-20.7% |
Background
363 Unit Rental Apartment Building – Toronto, ON
420 Bathrooms
363 Kitchens
Toilet upgrade to 1.6G / 3.0L in past 5 years
Annual Water Costs
2017 = $343K with per unit costs = $ 971.50
2018 = $417K with per unit costs = $ 1,181.09
2019 = $446K with per unit costs = $ 1,262.33
Current State: Escalating Water Consumption

January 2019 = 0.85 m3 / unit / day
September 2020 = 0.95 m3 / unit / day +11.8% increase over 21 month period
Inventory of fixtures included
Vanity faucets averaging over 2 GPMs.
Mixture of make/model of kitchen faucets average 2.1 GPMs.
Showers heads predominantly low flow and/or tenant installed hand-held shower units.
Vanity and Kitchen sinks included tenant installed adapters for dishwashers and/or washing machines.
Phase 1: In-suite audit and conservation package upgrade (inhibitors and aerators)
Phase 2: Toilet and Riser sensor installations for leak detection
Phase 2.1: Building network installation including receivers/repeaters and gateways for Real time monitoring, dashboards and cell phone connectivity
Phase I: Action
Flow audits to measure GPMs on bathroom vanity, kitchen sink and shower (pre and post).
Replace aerators on vanity and/or kitchen sink as appropriate.
Remove dishwasher and washing machine adapters.
Install Water Scrooge patented shower regulator behind wall / stem where GPM test indicated > 1. 5 GPM. This install included retention or replacement of existing SH in place. Stem where required was also replaced.
Re-test GPMs where modifications were made to vanity, kitchen and shower.
Evaluate fill valve and flush valve in 3.0L toilets.
Dye Test Flush canister for leaks.
Where leaking, replace fill valve seal and/or fill valve unit.
Replace Flush Cartridge in all HH toilets.
Report and document leaks at sinks, shut off valves, vanity and kitchen taps, tub spouts and/or shower heads.
Fixture Audit and Results
|
|
Count |
Avg GPM |
Avg GPM |
% Change |
|
Vanity Faucets |
420 |
1.95 |
0.75 |
-61.54% |
|
Showers |
420 |
1.6 |
1.25 |
-21.88% |
|
Kitchen Faucets |
363 |
2.1 |
0.95 |
-54.76% |
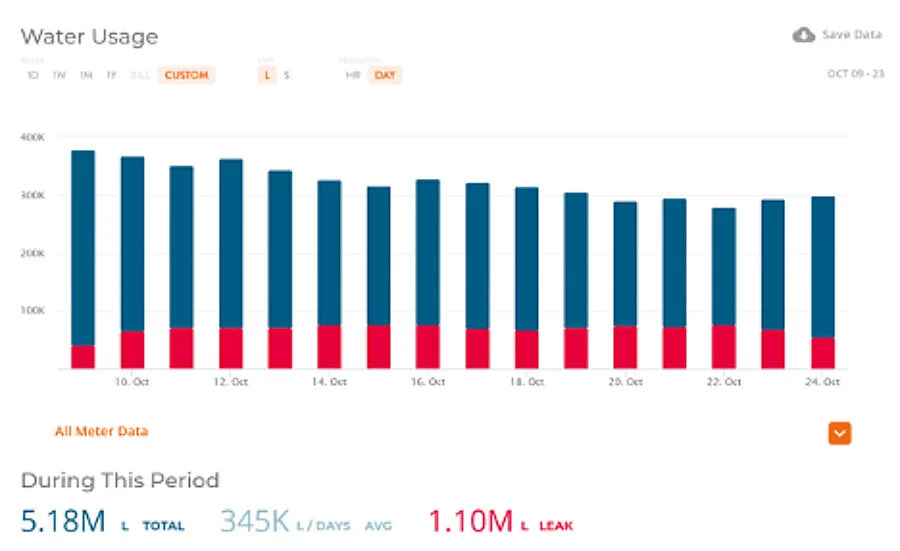
Post Upgrade Results
Peak of 378 m3 /day (Friday Oct 9th) to low of 279 m3 (Thurs Oct 22nd).
Upgrade work completed Monday October 19th, 2020.
26% reduction in daily consumption with further decreases anticipated through aggressive resolution of in suite water issues by way of leak detection.
Phase Two: Water Management Program - Leak Detection
We equipped each toilet supply line and cold water riser in the building with a WatchWatch™ sensor to detect leaks. The sensors communicate wirelessly over LoRa network to a series of wired receiver and repeaters which feed a control hub (Edge22) which in turn pushes the data to the cloud and supports desktop and mobile app. monitoring of leak activity.
Sensor installed on supply line to toilet:

Sensor installed on supply line to toilet
Sensor installed on Cold Water riser (Top Floor)

Sensor installed on Cold Water riser (Top Floor).
All cold water risers are mapped and identified to ensure reporting sensors can assist with isolating recurring water flow issues and support building management better understand the building water system.
Control Hub Receiving Sensor Feed:
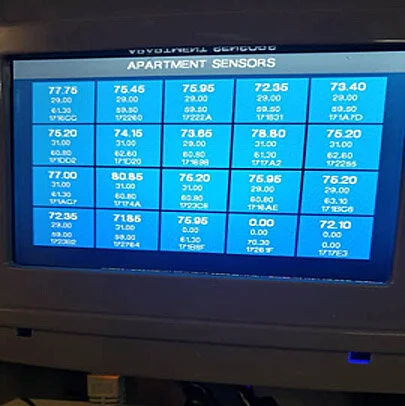
Control Hub Receiving Sensor Feed.
Each sensor’s signal is picked up by receivers installed in the hallways of the building. In this installation, there was a receiver and/or repeater on every second floor. The receiver reports directly into the hub. The repeaters simply repeat sensor transmission that is picked up by the receiver and strengthen the communication chain within the building.
Next Steps
Monitor toilet and riser feeds on dashboard and provide daily reporting and actionable steps to identify and immediately resolve leaks within the building in real time. Inspect individual toilets where sensors are indicating toilets are running or leaking.
Explore trends and patterns in riser detail to determine action steps to isolate where issues reside.
Key take-aways and results
In-suite work and conservation upgrades key to reducing m3 /unit;
Leak detection investment key to maintaining reduction and preventing it from scaling back up.
Post conservation (Phase 1) consumption is down from 0.95 m3 unit /day to 0.75 m3 /unit /day. The current milestone has brought per unit monthly water costs down to $96 /month from $122. Target is a further $10 to $15 reduction through aggressive leak management.
Building management now equipped to resolve building water issues ranging from leaks/running water to floods immediately to ensure water costs trend lower.
We are exploring the benefits of real-time water monitoring, for controlling insurance costs (premiums and deductibles).